

At a Glance
Summary
The Dynamic DNA Comprehensive Ancestry test provided a range of information about my haplogroups, my maternal and my paternal roots. I particularly enjoyed reading about the famous people that shared my haplogroups and exploring where in the world my ancestors had likely lived.
I was a little disappointed that there was no family finder feature in the maternal report, but discovering a potential living relative as part of my paternal results was a bonus. I also found the raw data section a little overwhelming, but the fact that it was included increased my trust in the results. The information that was provided was well explained and I think this test provides an excellent introduction for those wanting to explore their maternal and paternal ancestry.
Full Review
Dynamic DNA Laboratories is a company based in Springfield, MO. As well as conducting consumer tests, the lab carries out research, resulting in findings that have been published in several academic journals.
The company sells DNA tests across a range of categories, including health, paternity, art, and ancestry. Their ancestry tests are able to report on your maternal and/or paternal lineage, and they also offer an option to purchase both together for a more comprehensive view. I chose this option to find out more about my ancient ancestry.
Product Expectations
On the Dynamic DNA website I read that the Paternal Ancestry Test would analyse the Y DNA that I had inherited directly from my father and mitochondrial DNA, passed directly from mother to child, to report on my paternal and maternal ancestry respectively. It was made clear that the paternal test could only be taken by males, but that females could investigate their paternal ancestry by having a close paternal male relative (eg. father or brother) take the sample for them.
I went on to read that the test results would provide me with details about how my relatives migrated out of Africa and the frequency of my heritage in populations around the world. I would also learn about my paternal and maternal haplogroups and discover relatives.
There was also a section that explained why I should use DNA testing to research my ancestry, by empowering me to discover who my ancestors were, how and where they lived. It also put the test into context of other types of genealogy research, outlining how it could accelerate current research and provide information from much further back in time than other types of DNA tests.
The terms and privacy policy were straightforward and I didn’t see anything unusual. However, the privacy policy did refer to an informed consent form at points, which I couldn’t find a copy of on the website.
Ordering Experience
When ordering the test, I was given the choice to purchase the maternal/paternal tests alone or in combination for a reduced price, which is the option I went for.
I appreciated the warning, shown when I chose to include the paternal test, that a male sample was required, reiterating that females would have to submit a sample from a paternal relative in addition to their own.
The checkout process was pretty straightforward. I was able to pay either with a credit card or via PayPal and was pleased to see that shipping was free. The option to add delivery notes was also helpful, as I was able to provide specific instructions on how to get to my house, which is sometimes difficult to find for those making deliveries. I received an email confirming my order, and another in receipt of my samples reaching the lab.
The Results
A few weeks later, I received an email informing me that my results were ready. This email included a link that allowed me to view and download my results as a two separate PDF files. The front covers of the reports were similar and both looked professional but bright and fun.
Results Section: Understanding your Results
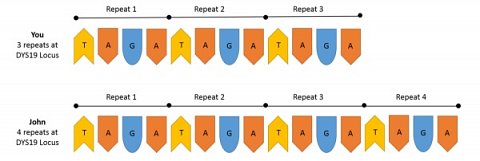
Both report started with an introduction to some of the scientific concepts that were relevant to the findings that followed, entitled ‘Understanding your Results’. My paternal report explained that the lab had analysed regions in my Y DNA known as ‘Short Tandem Repeats’ (STRs). Although this sounded pretty scientific, the explanation made it seem simple, and I learned that these were repeating sections in DNA sequences that vary between individuals.
The explanation was accompanied by a diagram that displayed an example of how this worked, using two DNA sequences (shown below).

Diagram that accompanied my Understanding your Results explanation.
This helped to consolidate my understanding of the concept and I thought it was an effective way of adding to the written explanation.
A section with the same title in my maternal report described how two parts of my mitochondrial DNA, known as ‘Hyper-Variable Regions’ (HVR) 1 and 2, were sequenced to look for variations that could be compared to those of others around the world.
The section then went on to explain a bit more about mitochondria, the home of mitochondrial DNA, how they compared my DNA to others, and a bit about haplogroups. The last of these topics was the one I was least familiar with and so I found the explanation particularly useful.
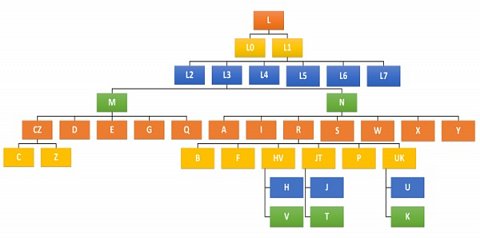
The paternal report also went on to explain Y haplogroups. I found it fascinating that there is one female and one male ancestor that everyone alive today is related to. This explanation was accompanied by a diagram, showing the ‘family tree’ of all haplogroups. I found this interesting but more difficult to understand than the STR information.
Next, I was able to see my personal results. In my paternal report, these started with a table containing quite a lot of information, including the name of the STR, ‘Genotypes’ and the probability of different haplogroups.
I found all of this information a bit overwhelming at first, but soon realised that I was able to apply the knowledge I’d gained in the previous section to interpret most of it. I was able to use this table to determine that I belonged to Y-haplogroup R1a, which was confirmed in the image caption. This said, there were still a few things I found confusing and the final part of this section also included a graph showing the raw data that had been used to measure the length of my STRs.
My maternal haplogroup (H2a2a) and raw data were also provided in this section of my maternal report (shown below).

Some of the raw data from my maternal report.
This was also quite confusing, though the caption that explained it did help me to understand a little about how it had been used to determine my haplogroup. Despite the fact that I didn’t fully understand it, I was pleased that the raw data was included. It isn’t something I’ve seen offered in any other ancestry tests and it increased my trust in the results.
I was a bit surprised that the report went straight from the raw data of my results into another introductory-style section, entitled ‘Getting Acquainted with The Stone Age’. It showed a timeline of different periods during the stone age, which was a useful feature to include. I did have to zoom in quite a lot to be able to read the writing on the timeline itself, which made it a bit inconvenient to refer back to when going through the rest of the report.
Results Section: Haplogroups H & R
The next section in both of the reports provided more details about my haplogroups. I was interested to learn that around half of Europe also belonged to maternal haplogroup H and that it was thought to have originated in either West Asia or in the north-eastern Mediterranean.
I also found out that haplogroup R was not only one of the most common, but one of the most geographically widespread paternal haplogroups. I was interested to read that my ancestors most likely left Africa around 27,000 years ago and migrated across Asia to Europe over the next 12,000 years.
The sections that followed the information about my broad haplogroups provided information about my specific haplogroups, which I learned was known as a subgroup or clade. It was unsurprising to learn that my maternal subgroup, H2a2a, was associated with origins in Germany, Denmark and the British Isles (I’m British) and this further consolidated my trust in the result.
I was even more intrigued to read about my paternal subgroup, R1a. I found out that although my oldest ancestors belonged to haplogroup R, this then split into R1 and R2, with my haplogroup (R1) slowly spreading eastwards across Europe.
My branch of R1a (M198), showed my paternal lineage to be primarily Scottish. I was surprised to learn this, as I don’t know of any Scottish relatives, but it had been determined with a high level of confidence and I do love the highlands! I hadn’t expected my origins to be defined this specifically, so was really impressed with this section of the report.
Results Section: Geographic Distribution and World Migration
The next section of the maternal ancestry went into more detail about the different areas of the world in which my haplogroups were most common. This included a table of the European populations where this haplogroup was most frequent and a pie chart that showed the relative frequencies of all of the maternal haplogroups currently known about (shown below).

Pie chart showing the relative frequencies of maternal haplogroups.
I thought that this was a great way to display the information as it was immediately obvious how large haplogroup H was, in comparison to others. It was interesting to look at other ones too, though it would have been interesting to see the geographic locations of these as well.
The ‘World Migration’ sections, which were present in both reports put my results into a bit more context, providing details of the other haplogroups and how their patterns of migration compared to mine. It described how all of our ancestors had originated in Africa and then migrated and evolved throughout the world, over several thousands of years. Maps showed the different routes associated with the different haplogroups. My paternal map is shown below.

Map showing the different routes of human migration.
Results Section: Associated Medical Conditions
I was a bit worried when I first read the title to this section, which was only in my maternal report, as I hadn’t anticipated or wanted any medical information when taking the test. However, it only included two, both of which were beneficial. According to my haplogroup, I should have a greater physical endurance when exercising and if I ever get sepsis, I’m more likely to survive. I’m not sure if all of the haplogroups had such positive examples of associated medical conditions but I was pleased that mine were.
Results Section: Genetic Matches and Famous Haplogroup Members
Both reports included a fun section that identified famous members of my haplogroups. I found out that I share a maternal haplogroup with Napoleon Bonaparte and that Tom Hanks is a member of my paternal one.
It was pointed out that my sharing a haplogroup didn’t mean I was related to these people (unfortunately!). However, my paternal report included a section on genetic matches. I was provided with information about someone I shared 18 out of 19 genetic markers with. I was a bit surprised that despite this sounding like we were closely related, it meant that there was around a 90% chance that we shared a relative 23 generations ago, and only a 10% chance that we shared an ancestor three generations ago.
I was provided with my match’s surname and, slightly confusingly, a contact name of someone with a different surname, as well as their user I.D. In order to find out more and to contact them, I was given a username and password for an account Dynamic DNA had made for me on a website called ysearch.
The final part of the report was 'Next Steps and References' and it outlined the ways that I could use my results as a base for further genealogy research. It included links to two websites that would help me to do this and also a list of references that I could use to explore the report in more detail.
Summary
The Dynamic DNA Comprehensive Ancestry test provided a range of information about my haplogroups, my maternal and my paternal roots. I particularly enjoyed reading about the famous people that shared my haplogroups and exploring where in the world my ancestors had likely lived.
I was a little disappointed that there was no family finder feature in the maternal report, but discovering a potential living relative as part of my paternal results was a bonus. I also found the raw data section a little overwhelming, but the fact that it was included increased my trust in the results. The information that was provided was well explained and I think this test provides an excellent introduction for those wanting to explore their maternal and paternal ancestry.
Please note that we were invited to take this test free of charge.
See a description of this DNA test from Dynamic DNA Laboratories >
At a Glance
Summary
The Dynamic DNA Maternal Ancestry report provided an interesting overview of my maternal lineage. I particularly enjoyed learning about my haplogroup and how it fitted into the history of human evolution and migration.
It was a little disappointing to discover that there was no family finder feature, even though the product description had suggested that I would be able to find relatives. However, the information that was provided was well explained and I feel that the test provides an excellent starting point for those that are looking to further research their maternal ancestry.
Full Review
Dynamic DNA Laboratories is a company based in Springfield, MO. As well as consumer tests, their lab carries out research which has resulted in the publication of several research studies.
They sell DNA tests in a range of categories, including health, paternity, art, and ancestry. Their ancestry tests are able to analyse your maternal and/or paternal lineage, and they also offer an option to purchase both together for a more comprehensive view. I took their maternal ancestry test to see how it compared to others on the market.
Product Expectations
On the Dynamic DNA website, I read that the Maternal Ancestry Test would analyse the DNA that I had inherited directly from my mother and would provide details about my maternal line, going back tens of thousands of years. More specifically, it would provide me with details about how my maternal relatives migrated out of Africa and the frequency of my heritage in populations around the world. I would also learn my maternal haplogroup and discover current relatives.
There was also a section that explained why I should use DNA testing to research my ancestry. It explained that I would discover who my ancestors were, how and where they lived. It also put the test into context of other types of genealogy research, outlining how it could accelerate current research and provide information from much further back in time than other types of DNA tests.
The terms and conditions didn’t reveal anything that struck me as unreasonable or unusual.
Ordering Experience
When ordering the test, I was given the choice to buy the maternal test alone or in combination with the paternal analysis for a reduced price compared to purchasing both separately.
The checkout process was pretty straightforward. I was able to pay with a credit card or via PayPal and was pleased to see that shipping was free. The option to add delivery notes was also helpful, as I was able to provide specific instructions on how to get to my house, which is sometimes difficult to find for those making deliveries. I received an email confirming my order, and another in receipt of my samples reaching the lab.
The Results
A few weeks later I received an email that contained my results as a downloadable PDF file (one for my maternal and one for my paternal ancestry). Opening the maternal results, I was greeted by a friendly but professional looking front page.
Results Section: Understanding your results
The results started with a brief explanation of the science behind the test, entitled ‘Understanding your results’. It described how two parts of my mitochondrial DNA, called ‘Hyper-Variable Regions’ (HVR) 1 and 2, were sequenced to look for genetic variations that could be compared to those of others around the world.
The section then went on to explain a bit more about mitochondria, the home of mitochondrial DNA, how they compared my DNA to others, and a bit about haplogroups. The last of these topics was the one I was least familiar with and so I found this explanation particularly useful. The accompanying diagram (shown below) that displayed the lineage of human haplogroups added to its value.

Diagram showing the various haplogroup lineages.
Diagram showing the lineage of human haplogroups.This diagram became even more useful once I had learnt my own haplogroup.
Helpfully, my haplogroup was revealed to be H2a2a in the subsequent section, ‘Your Sequencing Results!’, which also included the raw data that had been generated when my sample was sequenced (shown below).
Some of my raw data.
This raw data was a little confusing, though the figure legend that explained it did help me to understand a little about how it had been used to determine my haplogroup. Despite the fact that I didn’t fully understand it, I was pleased that this data was included. It isn’t something I’ve seen offered in other ancestry tests and it increased my trust in the results.
I was a bit surprised to find that the report went straight from the raw data of my results into another introductory-style section. It was entitled ‘Getting Acquainted with The Stone Age’ showed a timeline of notable events and evidence that has been discovered from this time. I thought that this was a useful feature to include, but felt that it was a little strangely placed within the report. I also had to zoom in quite a lot to be able to read the writing on the timeline itself, which made it difficult to quickly refer back to when going through the rest of the results.
Results Section: Haplogroup H
The next section provided more details about my haplogroup. I was interested to learn that around half of Europe also belonged to haplogroup, as did the reference sequence (the revised Cambridge Reference Sequence (rCRS)) that was used as a comparison. I also learned that there was debate over where it had originated, in West Asia or in the north-eastern Mediterranean. It was fascinating to read about the Gravettian culture that had developed along the same migratory lines associated with my haplogroup. I was a little disappointed to read that the exact routes couldn’t be more specifically defined, but the explanation that women during this time moved a lot between migrating/conquering tribes made up for this.
The section that followed the information about haplogroup H provided information about my specific haplogroup, haplogroup H2a2a, which I learned was known as a subgroup or clade. It was a bit disappointing to read that there was little information about my specific subgroup, but I realised this was understandable when it was revealed that there were over 90 of them within just haplogroup H.
It was unsurprising to learn that H2a2a was associated with origins in Germany, Denmark and the British Isles (I’m British) and this further consolidated my trust in the result.
Results Section: Geographic Distribution of Haplogroup H
The next section went into more detail about the different areas of the world in which haplogroup H (not my specific subgroup) was most common. This included a table of the European populations where this haplogroup was most frequent (shown below).

Table showing the frequency of haplogroup H in various European populations.
At first glance I thought my haplogroup was most common in Belarus as I thought that this table had been ordered by frequency. However, I quickly realised that it was sorted alphabetically and found the information really interesting, especially when I saw that the frequency was highest in Wales.
This table was followed by a pie chart that showed the relative frequencies of all of the maternal haplogroups known about (shown below).
Pie chart showing the relative frequencies of maternal haplogroups.
I thought that this was a great way to display the information, as it was immediately obvious how large haplogroup H was in comparison to others. It was interesting to look at other ones too, though it would have been even better if the geographic locations of these had also been shown.
Results Section: Associated Medical Conditions and Famous Members of Haplogroup H
I was a bit worried when I first read the title to this section, as I hadn’t anticipated or wanted any medical information when taking the test. However, it only included information on two medical traits, both of which were beneficial. According to my haplogroup, I should have a greater physical endurance when exercising and if I ever get sepsis, I’m more likely to survive. I’m not sure if all of the haplogroups had such positive examples of associated medical conditions but I was pleased that mine were.
Another feature that wasn’t of much practical use, but added a bit of fun was the ‘Famous Members of Haplogroup H’ section. I found out that this haplogroup included Napoleon Bonaparte, Nicolas Copernicus and Warren Buffet. It was pointed out that although we shared our haplogroup, this didn’t mean any of us were closely related. I wondered how they had determined that those such as Napoleon had belonged to this group, as he lived in a time before DNA testing, but this wasn’t explained.
Results Section: World Migration
The next section provided a bit more context to the results I’d received. It went over the ancient history of human migration, including about the ‘mother of us all’ (also known as ‘Mitochondrial Eve’), a woman that lived hundreds of thousands of years ago and to which all humans are related to. It also explained how humans had migrated from Africa to the rest of the world over several hundreds of years, information that was accompanied by a map showing the different routes associated with the different haplogroups.

Map showing the migratory routes associated with different haplogroups.
This map really helped to visualise the way in which different groups of people moved around the world across several thousands of years and the key made it easy to identify my haplogroup’s route.
The final part of the report was 'Next Steps and References' and it outlined the ways that I could use my results as a base for further genealogy research. It included links to two websites that would help me to do this and also a list of references that I could use to explore the report in more detail.
Summary
The Dynamic DNA Maternal Ancestry report provided an interesting overview of my maternal lineage. I enjoyed learning about my haplogroup and how it fitted into the history of human evolution and migration.
I was a little disappointed that there was no family finder feature, as the product description had suggested that I would be able to find relatives. However, the information that was provided was well explained and I think this test provides an excellent starting point for those that want a starting point for further research into their maternal ancestry.
Please note that we were invited to take this test free of charge.
See a description of this DNA test from Dynamic DNA Laboratories >
At a Glance
Summary
The Dynamic DNA Paternal Ancestry test provided a range of information about my paternal roots and haplogroup. I particularly enjoyed reading about the famous people that shared my haplogroup and discovering a potential living relative was a bonus.
The raw data section was a little overwhelming at first, and I didn’t fully understand the information in table and graph provided. However, the fact that it was included increased my trust in the results and the subsequent explanations meant that this wasn’t really a problem. This test would make a great introduction or supplement to traditional research for anyone interested in exploring their paternal ancestry.
Full Review
Dynamic DNA Laboratories are an Illinois-based DNA testing company that was set up by Austin O’Reilly in 2015, they offer a wide range of consumer DNA tests as well as carrying out their own research studies, some of which have been published in scientific journals.
The company offers several tests that determine biological relationships, assess genes linked to diet and fitness and some can even turn your DNA into art! I decided to take their paternal ancestry test to find out more about my lineage.
Product Expectations
On the Dynamic DNA website, I read that the Paternal Ancestry Test would analyse the Y DNA that I had inherited directly from my father and would provide details about my paternal line, going back tens of thousands of years. It was made clear that the test could only be taken by males, but that females could investigate their paternal ancestry by having a close paternal male relative (eg. father or brother) take the sample for them.
I went on to read that the test results would provide me with details about how my paternal relatives migrated out of Africa as well as the frequency of my heritage in populations around the world. I would also learn my Y haplogroup and discover current relatives.
In addition to the product description, there was a section that explained how DNA testing could enhance my ancestry research. It explained that it would allow me to discover who my ancestors were, how and where they lived. It also compared this type of test to other types of genealogy research, outlining how it could complement more traditional methods and provide me with details much further back in time than other types of DNA could.
The terms and privacy policy were straightforward and I didn’t see anything unusual. However, the privacy policy did refer to an informed consent document at points, which I couldn’t find a copy of on the website.
Ordering Experience
When ordering the test, I was given the choice of buying the maternal test alone or in combination with the paternal analysis for a reduced price compared to purchasing both separately.
I appreciated a second warning, shown when I selected the paternal test, that a male sample was required, meaning that females would have to submit a sample from a paternal relative.
The checkout process was pretty straightforward. I was able to pay either with a credit card or via PayPal and was pleased to see that shipping was free. The option to add delivery notes was also helpful, as I was able to provide specific instructions on how to get to my house, which is sometimes difficult to find for those making deliveries. I received an email confirming my order, and another in receipt of my samples reaching the lab.
The Results
A few weeks later, I received another email that informed me that my results were ready. This email included a link that allowed me to view and download my results as a PDF file. The front cover of the report looked professional but bright and fun.
Results Section: Understanding your Results
The results started with an introduction to some of the scientific and evolutionary concepts that were relevant to the findings that followed. This introduction explained that the lab had analysed regions in my Y DNA known as ‘Short Tandem Repeats’ (STRs). Although this sounded pretty scientific, the explanation made it seem simple, and I learned that these were repeating sections in DNA sequences which were variable between different people.
The explanation was accompanied by a diagram that displayed an example of how this worked in two DNA sequences (shown below).
Diagram that accompanied my Understanding your Results explanation.
This helped to consolidate my understanding of the concept and I thought it was an effective way of adding to the written explanation.
I also learnt that STRs are used in human identification, due to the fact that it’s extremely unlikely that any two people would share the exact same set. It also explained that Y DNA referred to the DNA on the Y chromosome, which is passed directly on from father to son, meaning that it can be used to trace many generations back in time.
The next part went on to explain what Y haplogroups were. I found it fascinating that they could trace all people back to one male ancestor who lived around 200,000 to 300,000 years ago, also known as ‘Y-Chromosomal Adam’. This was also accompanied by a diagram, showing the ‘family tree’ of all haplogroups. Although I found this interesting, I didn’t feel it was as well explained as the STR information had been, as I moved on to the next section without really understanding what haplogroups were or how they were classified.
Next, I was able to see my personal results. These started with a table containing quite a lot of information (shown below).

My results table.
This table was a bit overwhelming at first, as there was a lot of information within it. When I looked through it in more detail though, I was able to apply the knowledge I’d got in the previous section to identify that the column on the far-left was a list of the STRs that had been tested (confusingly very similarly named!). I assumed that the genotype columns included the number of repeats present, but wasn’t completely certain that this was the case and wasn’t sure why there was only one number in the ‘Genotype 2’ column.
The second side of the table was easier to understand, and I quickly determined that I was in Y haplogroup R1a, which was confirmed in the image caption. This caption also allocated me something described as a terminal SNP sub-group (mine was R1a-M918). I wasn’t sure what this was, but hoped it would be described later.
The final part of this section included a graph showing the raw data from the DNA sequencer used to measure the length of my STRs (shown below).

The graph showing my raw data.
I didn’t really know how to interpret this data, but was impressed that it had been included, as it illustrated the transparency of the process.
Once I’d looked through my data, I moved on to read about the Stone Age. This short section was centred around a timeline of the Stone Age which was interesting, though I was surprised that this hadn’t been included in the Understanding your Results section.
Results Section: About Haplogroup R
Although I was interested to find out what my Y-haplogroup was, I hadn’t really known what it meant in terms of my ancestral origins, so was pleased to see that there was a section providing some details about it.
In this section, I found out that haplogroup R was not only one of the most common, but most geographically widespread paternal haplogroups. I was interested to read that my ancestors most likely left Africa around 27,000 years ago and migrated across Asia to Europe over the next 12,000 years.
I was even more intrigued to read about my specific haplogroup, R1a. I learnt that although my oldest ancestors belonged to haplogroup R, this then split into R1 and R2, with my haplogroup (R1) slowly spreading eastwards across Europe. I was impressed by the level of detail included about this migration, including roughly how long it would have taken (5000 years), how their lifestyles likely changed over this time, and even which modern day countries it’s likely they migrated through (Belarus and Ukraine).
I was really pleased to scroll down to the ‘Your Branch of R1a – M198’ section, as I’d found this classification confusing earlier. The explanation cleared things up for me, revealing that this was one of the oldest types of R1a and therefore covered a wide area. The exact area was shown on a map, which is shown below.

Map showing the areas in which R1a is most common.
The percentages on the map made it clear exactly where the haplogroup was most common and I was surprised to see that it didn’t seem to be particularly associated with the UK (I’m British). However, below this map was another that showed my most recent ancestors were likely to have lived in Britain. It acknowledged that it wasn’t a particularly common haplogroup in Britain (apparently, I’m in the less than 5% minority in this haplogroup in the UK), but went on to explain that my ancestors may have been Viking or Norse people that invaded between the 8th and 15th centuries.
The main revelation in this section was that my paternal lineage is primarily Scottish. I was surprised to learn this, as I don’t know of any Scottish relatives, but it had been determined with a high level of confidence and I do love the highlands! I hadn’t expected my origins to be defined this specifically either, so was really impressed with this section of the report.
Results Section: Genetic Matches and Possible Living Relatives
The information about my DNA that was explained in the previous part had also been inputted into a database, allowing Dynamic DNA to provide me with information about someone I shared 18 out of 19 genetic markers with. I was a bit surprised that despite this sounding like we were closely related, it meant that there was around a 90% chance that we shared a relative 23 generations ago, and only a 10% chance that we shared an ancestor three generations ago.
I was provided with my match’s surname and confusingly a contact name of someone with a different surname, as well as their user I.D. Details of our most distant ancestor and their country of origin were also included. Apparently, I also had matches to those with the surnames Turner, Shoesmith and Morrison but no further details were provided about these potential relatives. In order find out more and to contact them, I was given a username and password for an account Dynamic DNA had made for me on a website called ysearch.
Results Section: World Migration
The ‘World Migration’ section put my results into a bit more context, providing details of the other haplogroups and how their patterns of migration compared to those of R. It described how all of our ancestors had originated in Africa and then migrated and evolved throughout the world, over several thousands of years. A map showed the different routes associated with the different haplogroups (shown below).
Map showing the different routes of human migration.
It was interesting to see how haplogroup had several routes, leading to almost every continent, and how these compare to the others.
Famous People from Y-Haplogroup R1a
The next section was probably the most fun. I learnt that I shared a haplogroup with Tom Hanks, David Hume and Sir Francis Drake, which were pretty cool people to have links to! However, it pointed out that despite sharing a haplogroup, there is unfortunately a very low chance we’re closely related. Although this section was more for fun than anything particularly useful for my genealogy research, I thought it was a great addition to the report.
The final part of the report was 'Next Steps and References' and it outlined the ways that I could use my results as a base for further genealogy research. It included links to two websites that would help me to do this and also a list of references that I could use to explore the report in more detail.
Summary
The Dynamic DNA Paternal Ancestry test provided a range of information about my paternal roots and haplogroup. I particularly enjoyed reading about the famous people that shared my haplogroup and discovering a potential living relative was a bonus.
The raw data section was a little overwhelming at first, and I didn’t fully understand the information in table and graph provided. However, the fact that it was included increased my trust in the results and the subsequent explanations meant that this wasn’t really a problem. This test would make a great introduction or supplement to traditional research for anyone interested in exploring their paternal ancestry.
Please note that we were invited to take this test free of charge.
See a description of this DNA test from Dynamic DNA Laboratories >