

-
Infinome
review on 23 July 2018
by Rebecca Fishwick

At a Glance
Summary
While the information offered by Infinome was complicated and difficult to navigate, I understood that this was intended as an open science project, and so user friendliness was not their primary goal. The project was free to participate in, and so I was impressed by the amount of referencing that went into the results I was given, even if those results weren’t easy to understand! I could view both the parts of my genome they had analysed, and also the scientific papers they had referenced for their interpretations of my data.
Had I had a fitness or sleep tracker to link, I could have contributed this information to the project, while tracking my health progress for myself.
Full Review
Infinome is a citizen science project with the aim of extending people’s lives through genetic research. They hope to do this by identifying the sorts of lifestyles that promote optimum health, and to learn about the genetic basis of disease and help future scientists create therapies, and educate the public on the biological basis of certain diseases.
The project was founded by Clinton Mielke, PhD, who suffers from metabolic syndrome, and Roeland Hancock, PhD.
Product Expectations
From the Infinome website, I learned that the project was aimed at using genetics and lifestyle data from the general public in order to gather as much information as possible about the interplay between genetics, fitness, diet, disease, and general wellness.
A video on their homepage delved deeper into the process. From this, I learned that many Americans suffer from obesity, high blood pressure, and diabetes. People with metabolic syndrome (involving high blood pressure, high blood sugar, excess body fat around the waist, and high cholesterol or triglyceride levels) are at greater risk of developing heart disease, a leading cause of death.
According to the information, as many as seven in ten Americans weigh too much, and one third are obese, meaning they die ten years early on average. Certain genes had been identified and associated with obesity. Due to genetic differences in metabolism, some people find they must exercise a lot more in order to avoid excess weight.
Through Infinome’s project, they hope to combine information from genetics and health and exercise trackers in order to get a complete picture of the interactions between genetics, activity, sleep patterns, diet, and other lifestyle factors.
If I shared information from a fitness tracker (such as Fitbit), I would be able to gain insights into how my health might improve through my activity levels, and compare my health and fitness data with other anonymous participants.
There was plenty of information about the science behind their research. I read that our brains have a weight “setpoint”, which means that when we lose weight, our metabolism falls in order to prevent too much energy being burned. This leads to fatigue, which is why many diets fail.
Several genes have been discovered that regulate body weight, and scientists have found that as much as 70 to 90% of body weight is genetic. People whose genetics make it harder to lose weight can still do so through diet and exercise, only they may require a more intensive regime.
Ordering Process
Before creating an account, I took a look at the Privacy Policy. This was very short, which made it pretty simple to understand! They listed the information they would take from my 23andMe account, fitness trackers, and Facebook (if I linked it).
I saw they would use my ancestry data internally for research purposes (it would not be shared with third parties). From fitness trackers they would collect steps per day, calories burned, sleep data, and body measurements (when available) for internal research.
If I chose to integrate with Facebook, the ancestry visualiser would show me the ancestry breakdown of my friends. Infinome would collect my name, profile image, and friends list, but would not share any of my data with Facebook.
As soon as I unlinked an account (such as 23andMe), they would delete my data from that service.My data would be aggregated for study (i.e., studied in a large group with other people’s data, making it more anonymous). My data wouldn’t be shared without my permission, and would be stored on their SSL encrypted server.
I did not have to create an account as such. I had only to go to the “Genetics Report” page, and then link my 23andMe account. I was asked whether I wanted to grant access to Infinome. They would have access to all of my genomic data, genotyped information, ancestry analysis, my name, email address, date of birth, and self-reported information like height and weight.
Once I’d granted access, I was invited to link a fitness and/or sleep tracker (which could be a Fitbit, Jawbone or Withings) if I had one. I was encouraged to share Project Infinome on Facebook to help them collect more data.
I was then able to view my results.
The Results
The results were divided into ancestry, genetic health risks, and fitness stats.
Results Section: Ancestry
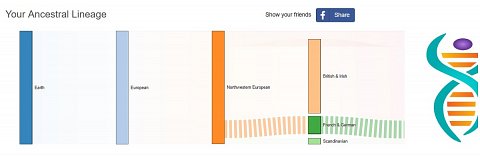
I first went to the ancestry section, which consisted of only a couple of diagrams. The first showed me my own ancestry (shown below).

My ancestry diagram.
As you can see, this wasn’t much information. Had my ancestral admixture been more diverse, then my diagram would probably have been more interesting. I was able to move my “British & Irish”, “French & German” and “Scandinavian” ancestries up and down. Had there been more ancestries in the diagram, this feature might have been more flexible.
The second diagram showed an example of someone with a lot more different ancestries than me, whose results were further broken down into “European”, “East Asian, & Native American”, “Ashkenazi”, etc.
I got the impression that the ancestry breakdown was only there to add interest. After all, anyone with 23andMe data already has their ancestry analysed, though the conductors of the study may find the information useful for their research.
Results Section: Genetic Risks
The next section I looked at was genetic risks. This consisted of a Manhattan plot diagram (shown below).

A Manhattan plot diagram showing my genetic risks for obesity.
I could alter this diagram to show different risks for different diseases, such as type 2 diabetes, heart disease, high blood pressure, certain cancers, and so on. This might have been very interesting, had I been able to understand what the chart was showing.
Clicking on the different variants they’d picked out, I found I could read more information about them, such as my genotype, and what studies had found about the different alleles (two letters of DNA that make up a genotype).
There was a button reading “View SNP Catalogue”. Clicking this, I found I could view the different SNPs/genetic variants they had looked at for each condition. By selecting “Type 2 diabetes”, I found I could view all the SNPs they’d analysed, the risk alleles, which genotype (or allele pair) I had, which gene it was located in, and what studies they had looked at (shown below).

A section showing the SNPs analysed for type 2 diabetes.
Results Section: Fitness Stats
The “Fitness Stats” section was where my fitness information would go if I linked a device. I was met with a very complicated-looking diagram which I believed would display my monthly data and the different activities I’d done (shown below).
A diagram showing what my fitness stats would look like.
This was located on the “Activity” tab. There were different tabs for “Weight”, “Comparisons”, “Correlations”, “Sleep”, and “Friends” (with a Facebook icon, which presumably showed how your linked Facebook friends were doing).
I found that weight data could be obtained from a smart scale, and that a chart would show me how my weight had fluctuated while participating in the study.
In “Comparisons”, there was a chart showing how my results might compare to others in the study (all aggregated anonymous data) in terms of number of steps, distance walked, stairs climbed, calories burned, time asleep, and sleep efficiency.
Clicking on “Correlations”, I was met with a series of confusing diagrams, which maybe would have made more sense had I actually been contributing data!
The “Sleep” tab also contained a number of tables and charts, which could be generated by linking a Beddit device. These would show me my hours slept, time gone to bed, time woken up, and comparisons of how long or well you slept on different days. A scatter diagram would show heart and respiration rates, and the whole would generate an average sleep score.

Sleep information diagrams.
I’m sure if I had a device to link, the information generated would be very interesting, and possibly helpful in forming good habits.
Summary
While the information offered by Infinome was complicated and difficult to navigate, I understood that this was intended as an open science project, and so user friendliness was not their primary goal. The project was free to participate in, and so I was impressed by the amount of referencing that went into the results I was given, even if those results weren’t easy to understand! I could view both the parts of my genome they had analysed, and also the scientific papers they had referenced for their interpretations of my data.
Had I had a fitness or sleep tracker to link, I could have contributed this information to the project, while tracking my health progress for myself.