×

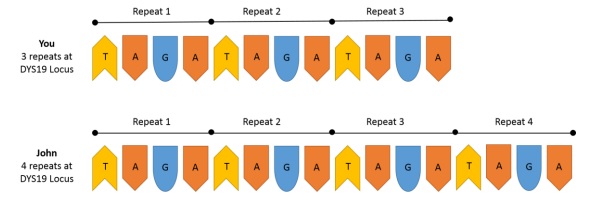
Screenshot 1 of 4

Diagram that accompanied my Understanding your Results explanation.

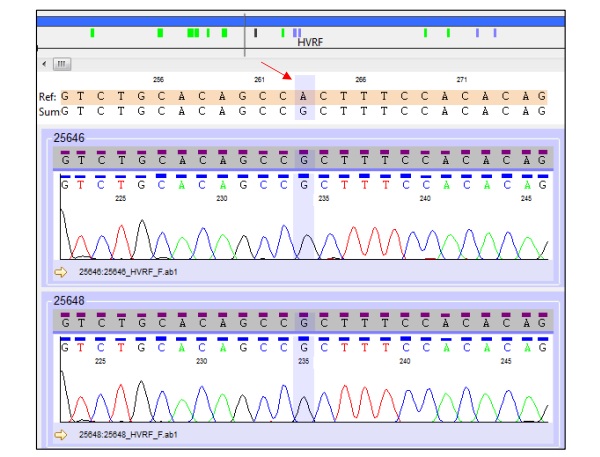
Screenshot 2 of 4

Some of the raw data from my maternal report.

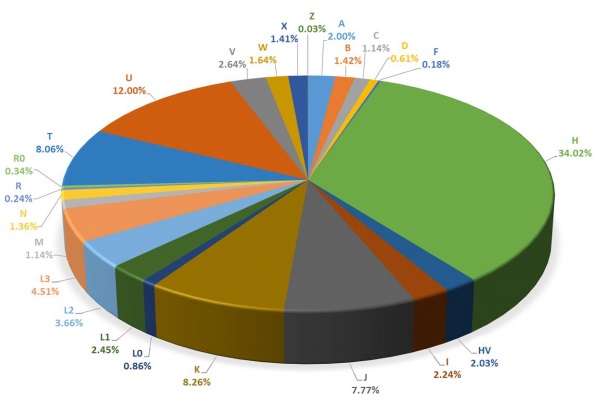
Screenshot 3 of 4

Pie chart showing the relative frequencies of maternal haplogroups.

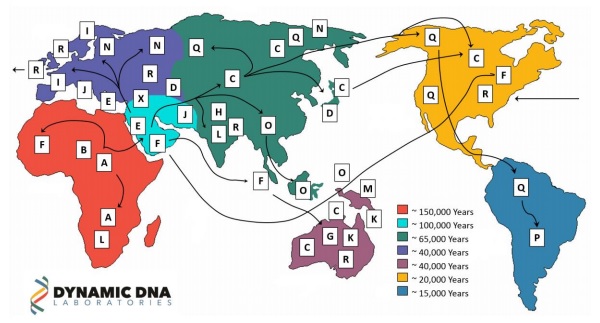
Screenshot 4 of 4

Map showing the different routes of human migration.