×

Screenshot 1 of 5

My ancestry diagram.

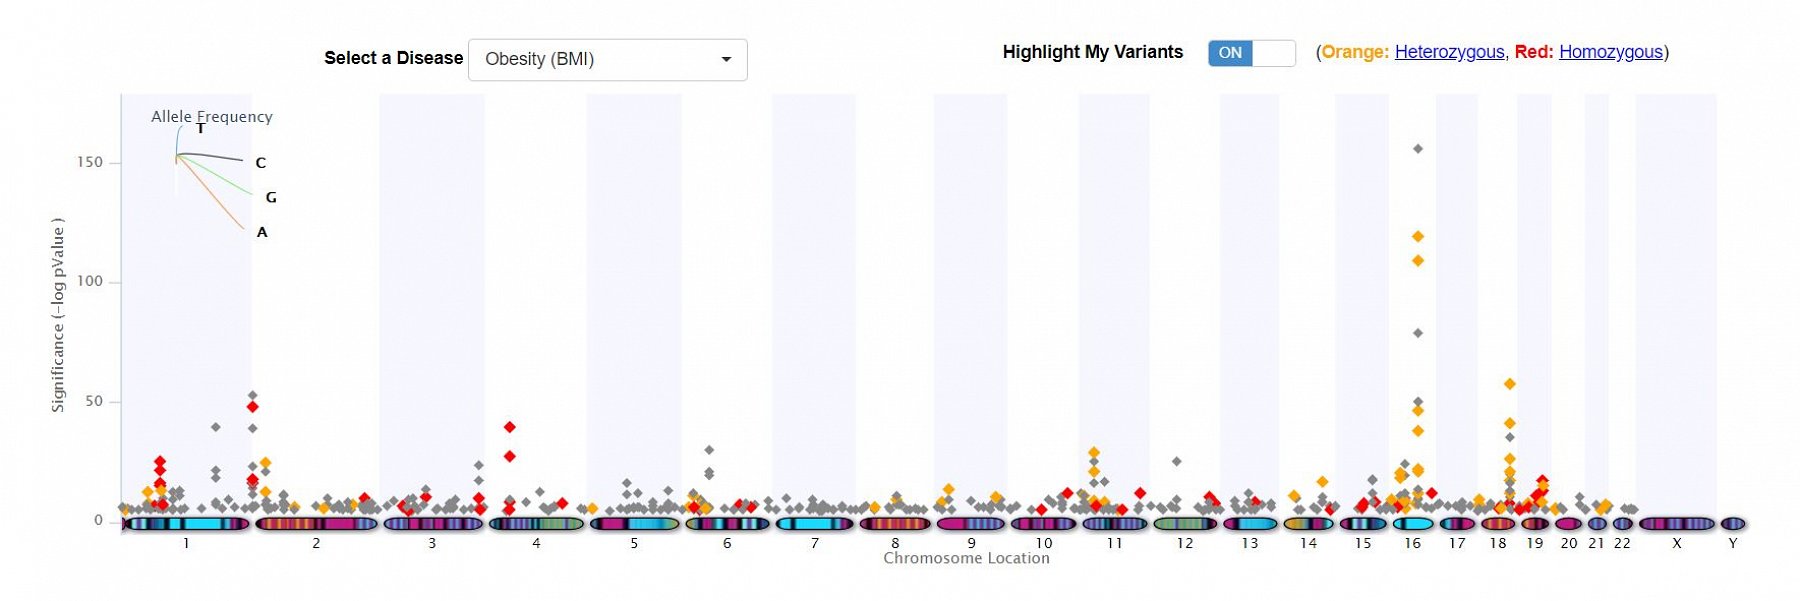
Screenshot 2 of 5

A Manhattan plot diagram showing my genetic risks for obesity.

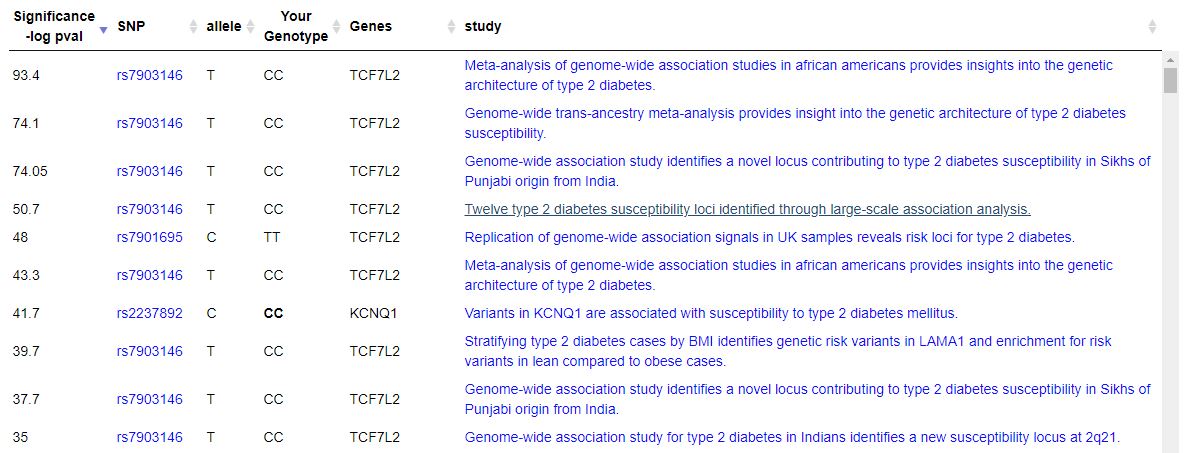
Screenshot 3 of 5

A section showing the SNPs analysed for type 2 diabetes.

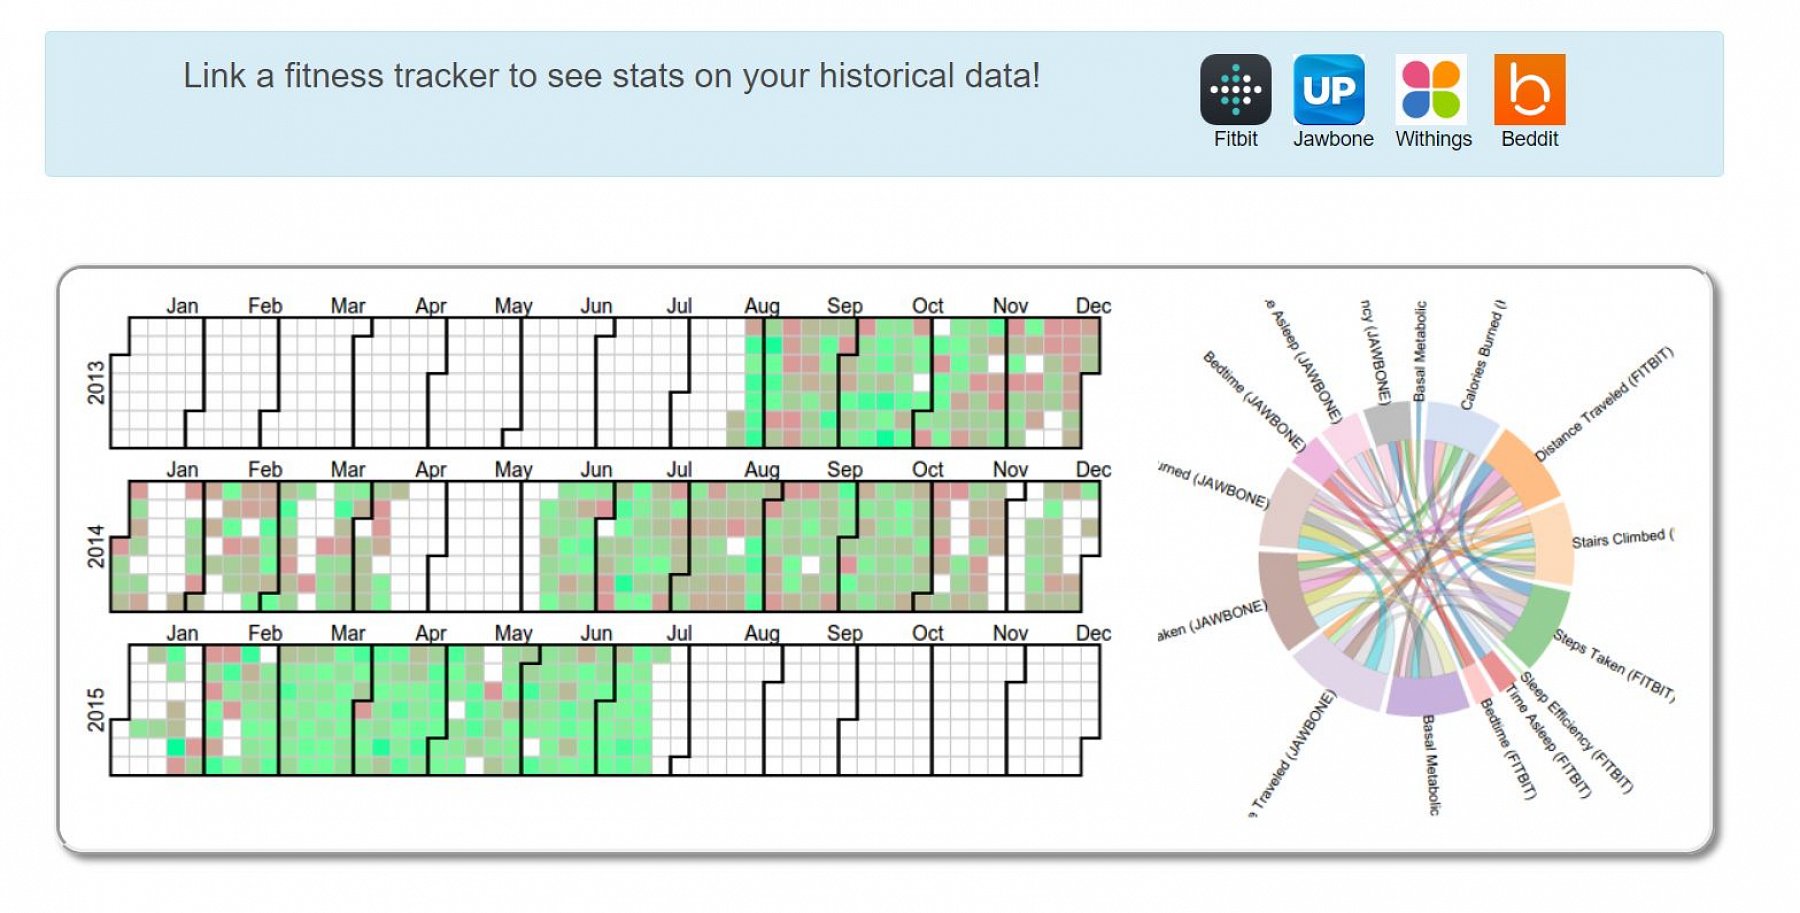
Screenshot 4 of 5

A diagram showing what my fitness stats would look like.

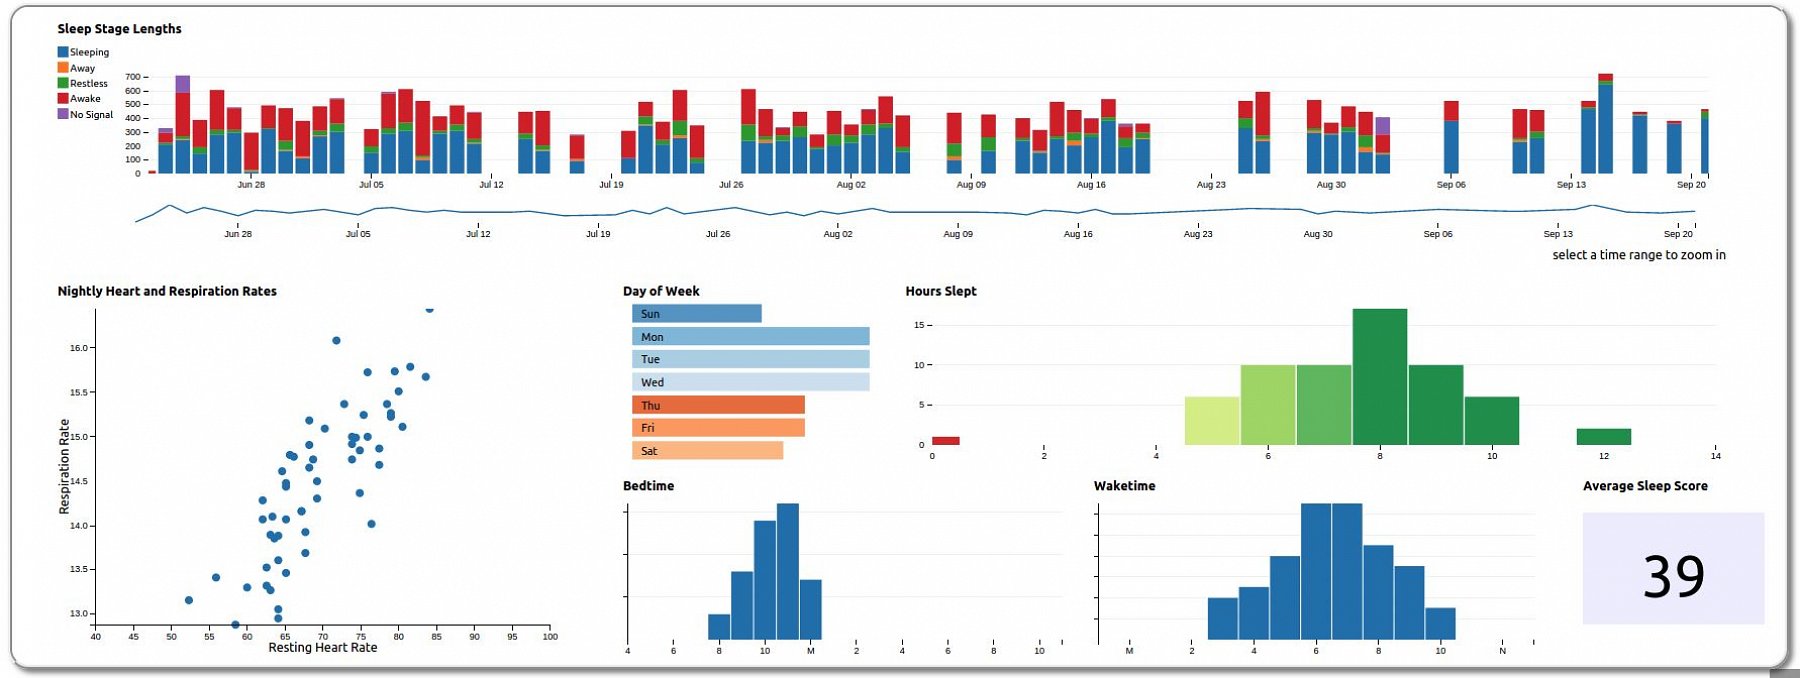
Screenshot 5 of 5

Sleep information diagrams.