

-
Codegen Health App
review on May 30, 2018
by Rebecca Fishwick

At a Glance
Summary
I found the service offered by Codegen both comprehensive and generous. For a free service, Codegen provides information about a startling amount of genetic variants covering multiple aspects of health. While it would be unlikely that anyone would go through the whole report (which was very long), their smart search function and prioritizing algorithms meant that it was easy for me to find the results that were most important, relevant, and interesting.
Full Review
Codegen is a free genomics service established in 2015, which provides the opportunity to explore your genetic data in their online interface, and see how your genetic variants can impact your health.
Product Expectations
The Codegen website was sleek and fairly minimalist, with not much information provided on the surface. I read that their service was both free and anonymous, and would allow me to explore my genetic data in depth.
I saw that once I uploaded my genomic data, their algorithms would generate a 1600-3000 page report. This would make for a pretty long read, only I saw that one of the tools included was a “modern search”, which would use a “modern query formulation experience”, and so make it easier for me to find the traits, diseases, or drug responses that I’m interested in.
I read that the report would cover “genotype-disease associations” for over 2000 diseases across 15 major topics, including cancer and aging. The associations between genotypes and traits came from “high confidence” GWAS studies. In my personalized dashboard, I would find nutrition and fitness information relevant to my genetics. My results would also be grouped using a “machine learned relevance model”, to make it easier for me to find my most important results first.
There was also the option to post comments and read those submitted by other users, and receive updates on the genotypes I’m most interested in.
In the FAQs section, I found that the information provided in the reports is sourced from third parties such as SNPedia and dbSNP (belonging to the US National Library of Medicine). Codegen did not accept liability for the “accuracy, usefulness or availability of any information transmitted or made available via the site”. Additionally, the reports were for informational purposes only, and not to be taken as medical advice.
There was also information about the “impact scores” they gave on their reports, which showed how each particular genotype (my variation of a gene) could influence my likelihood of having a trait, or developing a disease. The score would be given as a value between 0 and 10, with a very low score showing a very slight predisposition, and a higher score showing a high predisposition.
Each genotype would also have a “genotype frequency”, which would indicate the frequency of that genotype among the population. A low frequency percentage would indicate that it is less common, and a higher percentage would indicate that it is more common.
I read that there would also be a “topic score”, with a negative number to indicate a negative predisposition or a warning, and a positive number for all other traits. The topic scores would represent an overall likelihood of having or developing a trait or disease, and consider the individual scores of all the genotypes within that topic. However, I read that the impact of individual genotypes was likely to be more relevant than the topic score. I imagined this would all be clearer once I saw my report.
Ordering Experience
Clicking on “Start Exploring”, I found I could connect directly with a 23andMe account, or upload a file of my raw genetic data from Genes for Good, Ancestry.com, MyHeritage, Vitagene, WeGene, Family Tree DNA, or 23andMe. There were also instructions for obtaining the raw data file from each provider.
Before continuing, they recommended I read their Privacy Policy and Terms of Service. The Terms of Service were not long, but listed the sources Codegen used for generating their reports. As well as SNPedia and dbSNP, they used data from Genecards, Get-Evidence, the NHGRI-EBI Catalog of published genome-wide association studies, PUBMED, OMIM, and others.
In their Privacy Policy, I read that Codegen would never share or sell my data. The service had been designed to be anonymous, and they recommended that the “most anonymous” way to use it would be to upload my raw data file (since that way they wouldn’t receive my email address).
I learnt that they would, however, disclose my data if required to do so by law (i.e. by a subpoena or court order, etc.). They stressed that so far they had never been required to do this.
Another thing they emphasized was that since they offer a free service and use their own money to run the platform, they were not associated with any other organization, and therefore had no conflict of interest.
Once I uploaded my raw data file, their copy would be immediately deleted after the genetic data report was generated. The report would contain only anonymized data, and would be deleted after seven days, or sooner if I chose to erase it.
I also learned that they collected data using Google Analytics and Facebook and Twitter widgets, but these would not disclose any of my personal information to Google, Twitter or Facebook. Additionally, the Codegen site used only one cookie, which could remember a site user’s preferences, and would expire in six hours.
I read that all traffic to the website was encrypted using https, and my uploaded data would be kept in a “well protected location”. Still, they could not “ensure or warrant” the security of any information I sent or received.
Having read their Privacy Policy, I decided to upload my raw data file.
The Results
My report was generated almost instantly. I was immediately met with a list of several of my genetic variants, which their algorithms had decided were more relevant or interesting for me. There was a short tour of the user interface, which took me through features such as marking my favorite genotypes or using the dashboard.
Results Section: Main Report
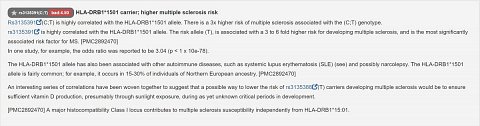
My first result wasn’t too promising. I found that my version of the rs3135391 gene gave me a three to six times higher risk of developing Multiple Sclerosis (MS). Yet there wasn’t any indication of what the baseline risk for developing MS was, and so I didn’t know whether a likelihood of developing it that was six times higher would actually be significant.
Clicking “Show More”, I found a link to a research article about the connection between my genotype (C;T) and MS. I could also browse anonymous user comments, most of which were people stating that they did or didn’t have MS, or whether they had any family history of the disease (shown below).

Information about the genotype associated with a higher risk for MS.
I also found I had a 1.7 times higher risk of obesity than most, thanks to my C;C genotype of the rs1421085 gene, with C being a “risk” allele. I found that only 5.23% of people had this genotype, which had a risk score of 3.90, and was considered “bad”. For this genotype, there were links to quite a few research papers. Still, the comments varied from people claiming to have been skinny their whole lives with little effort, and others claiming to have struggled with obesity since childhood.
I also had a higher risk of melanoma, squamous cell carcinoma, celiac disease, coronary heart disease, and type-1 diabetes.
In fact, most of my “interesting” results were bad news, and I often came across users commenting that their results had made them afraid, which was only exacerbated by the stories of users who either had these conditions, or whose family members had developed them or died from them. Had the baseline risk of developing each disease or condition been given (or better: an estimated risk percentage based on the individual’s genotype and the baseline risk), then the user experience would have been far less unsettling!
Results Section: Favorites
In the navigation bar, I found I had a “Favorites” tab. This was where the genetic results I’d marked as my favorites would show (shown below).

My “Favorite” Genotypes.
There was a list of genotypes that others had marked as favorites. These were mostly to do with personality. I had a look at my copy of the “Warrior/Worrier” gene, and found that I had both copies of the Warrior allele. There were plenty of studies linked to this gene, and in the information I found that Warriors were better at performing under pressure, and had a higher pain tolerance.
I also found I had a reduced memory, that I was optimistic and empathetic, that I handled stress well, that I had a normal risk for anxiety disorder, and that I was less likely to live to 100.
Results Section: Topics
There was also a “Topics” tab with a drop-down menu showing the different areas I could explore within my results, such as aging, cancer, immune health, reproduction, neurological health, and so on.
For each topic, I had a “topic score”, which took into account all of the genetic variants within that topic, and my risk score for each. This was displayed on a graph, showing my result relative to the population (shown below).

My topic risk score for neurological conditions.
For neurological conditions, my topic score was -24.72, whereas the average was about -18. Since my score was a more negative number than the average, my overall risk was higher than average.
Scrolling through the genotypes relating to neurology, I found I had a slight risk of Parkinson’s disease, a higher risk of Alzheimer’s, and a slightly increased risk of lupus. In fact, most of my related genetic variants showed a slight risk of something, and so it wasn’t surprising that my risk score was higher than average!
My topic score for psychological conditions also wasn’t great. Looking through the variants listed there, I found I had a few that could increase my risk of schizophrenia, and also ADHD. I have no family history of schizophrenia, however, and so I doubted my actual risk was actually that high. (They estimated 1.2x the average, but I imagine the average is very low.) But again, there might be some people who see they have an increased risk and become worried – most of the time unnecessarily.
After searching a while, I found there was some good news hidden in my genes. Though I’d been told I was unlikely to live to 100, I found that overall I had a pretty good risk score for aging of around -2.5, which was slightly better than average.
Still, I had slightly high risk scores for cancers and cardiovascular conditions, and my overall risk score for developmental conditions was so bad it seemed a wonder that I’d even survived childhood. While I found this all very interesting, and wasn’t seriously concerned by the red flags, I realized that an in-depth exploration of this report wasn’t for the fainthearted.
Results Section: My Dashboard
Clicking on the “Dashboard” tab, I was met with a graph showing my “Top 10 Risk Scores” compared with the general population. This showed whether my impact scores (which could be good or bad) were higher or lower than average (shown below).

My Top 10 Risk Scores vs. the General Population.
The different genotypes shown on the graph were listed by their rsID numbers. Beneath the graph was a list of the genotypes they’d looked at, including the ones associated with Multiple Sclerosis, obesity, celiac disease, and metabolism.
There was also a list of my “Top Established Negative Associations”, which was cheerful to look at. This included diseases and conditions I had a higher risk of developing, such as type-2 diabetes, MS, Crohn’s disease, and Alzheimer’s.
Scrolling down my dashboard, I found there was also a list of vitamins and nutrients that my genetics could impact my metabolism of, and also information about my genetic fitness (shown below).

Links to information about vitamins and nutrients, and my genetic fitness.
Clicking on each item took me to the related genetic variants, and I could see whether my genes had a positive or negative impact.
Lastly, I had the option to “Logout” (though I didn’t have any login details, I could end my session) and to erase all my uploaded data.
Summary
I found the service offered by Codegen both comprehensive and generous. For a free service, Codegen provides information about a startling amount of genetic variants covering multiple aspects of health. While it would be unlikely that anyone would go through the whole report (which was very long), their smart search function and prioritizing algorithms meant that it was easy for me to find the results that were most important, relevant, and interesting.