Ancestral Origins (Standard)

Visit Website >

Ancestral Origins (Standard)

Ancestral Origins (Standard)
£ 149.00

Description

The ‘Ancestral Origins™ (Standard)’ test from Home DNA Direct analyses your autosomal DNA. It reports on your ancestral origins and the modern populations you share your DNA with.

Features

  • Includes a printed map (43 × 27cm)
  • Uses the Focused GeoGenetic Database
  • Can be taken by males and females

What you’ll receive

A standard sized map (43 × 27cm) printed on glossy photographic paper which displays:

  • The location of your ancestors before recent human dispersal in the form of a Native Region Matches map
  • The location of modern populations that you share your DNA with in the form of a Population Matches map
  • You’ll also receive printed guides and your internationally recognised STR DNA Profile

In addition…

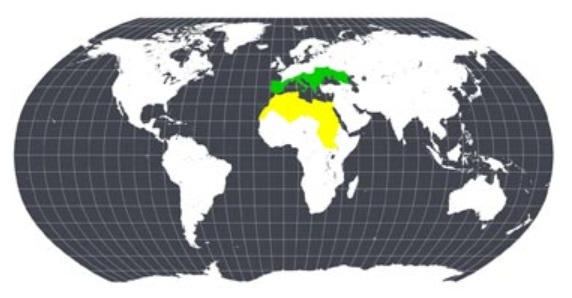
With this simple DNA ancestry test, your DNA profile is compared against hundreds of global populations and fourteen anthropological regions whose collective genetic information is known and scientifically validated. The scientists then measure the likelihood that your genetic information is linked with each of those populations and regions, and plot the results on a very high resolution map which illustrates your unique geogenetic heritage from both a per-population view, and an overall regional view.

Results

Results include a 10 page report and a high resolution map. You will discover the following information:

  • Population matches: This test will measure your DNA individually against every population in our database, and mark how strongly your profile matched against each. On the population match map, each population has a shape which tells you which anthropological region that population belongs to, as well as a colour to indicate how strong of a match you had with it.
  • Native Region Matches: Running a completely new set of calculations, and not using any of our “dispersed population” regions, the ancestral origins test determines which anthropological native regions you have the strongest links with. The strongest match is indicated in green, any subsequent matches are indicated in yellow.
  • Strength indicators: The first strength indicator graph looks at the cumulative strength of all the populations in your matched regions, and shows you how strong each region is in comparison with each other. This way, you not only know how strong individual populations are with the population match map, but can look at the larger picture, and know how each represented region measures up with any other regions you may have matched.
Visit Website >