-
Free Genome Report
review on 29 June 2017
by Ellen Hinkley

At a Glance
Summary
The Enlis Genomics report was interesting but complex. One aspect that I particularly enjoyed was the use of stars, which indicated the level of research supporting each result.
For a service that appeared to be much more academically than consumer focused, I was surprised that the references were a bit vague. I also wasn’t sure why macular degeneration had been focussed on in my phenotype report, as I didn’t appear to be at particularly high risk of this disease.
This report would best suit someone interested in deeply exploring the scientific details and research associated with their genetic variants, but probably not someone who is looking for a straightforward and easily implementable guide to their DNA data.
Full Review
Enlis Genomics is one of an increasing number of companies that re-analyses data you’ve received from a previous test, rather than analysing new biological samples. Their service, which primarily caters to research scientists, focuses on analysing DNA data to provide users with information about the health risks associated with specific genetic variants. They initially developed software that allowed researchers to analyse full genome files but have since added a personal use software program, as well as a free genome report that’s accessible directly from their site. We thought we’d give it a go to see how it compared to other re-analysis platforms.
Product Expectations
The Enlis Website was mainly focused around their software products, so it wasn’t immediately obvious where I should upload data for my free report or even that this option was available. However, I eventually found that the ‘Import’ section was the one I was looking for. This page provided an overview of the process and I learned that I could use 23andMe, AncestryDNA or Family Tree DNA files, as well as full exome or genome data in VCF format. There was a help section that provided advice about how to extract these files from the original provider that I had tested with, accompanied by screenshots.
As well as the types of files compatible with the service, an approximate time that each file type would take to be imported and analysed was given. I was also informed that an email would be sent once this process had been completed. I hadn’t seen this before and it provided a useful reference that I realised would be helpful in recognising if something went wrong during the upload process.
As well as information about the service, several sample reports were provided. Examples of the ‘Summary Report’ and ‘Phenotype Report’ were given for genome, exome and 23andMe files. These gave me a great idea of what to expect from the report, though I wasn’t sure which was included as part of the Free Genome Report. I also noticed that each of the Phenotype Report samples focused on one specific health condition, and wondered whether this was to do with the file type or the results of the Summary Report.
It was difficult to find the Enlis Genomics terms and conditions, which I assumed didn’t exist, until I’d entered my email address. However, once I did read them I was really impressed. Both the terms and the privacy policy were written in a straightforward, easy-to-read way, and unusually, it was made clear that none of my genetic data would be shared with partner companies or even researchers.
Ordering Experience
Before importing my data, I had to enter my email address and agree to the terms and privacy policies. I also ticked a box to indicate that I understood that the information was for educational and research purposes and didn’t constitute medical advice.
Once I’d done this, I was able to upload my file. I chose to use my whole genome VCF file, to get as much information as possible.
The Results
I received an email about 40 minutes after uploading my file, which informed me that my import had been successful and which included my reports as PDFs. I received a ‘Summary Report’ and a ‘Phenotype Report’.
Results Section: Sequencing Coverage
Having seen the examples on the website, I assumed that the Summary Report would provide the most information, so I decided to look at this first. The initial page was colourful and included four pie charts showing my ‘Sequencing Coverage’. These are shown below.
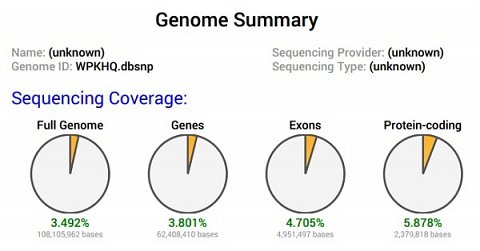
My Sequencing Coverage pie charts.
I was slightly confused by this section. I’d used the data I’ve received from having my whole genome sequenced, but, from what I could tell, these charts seemed to suggest that the data was only 3.492% of my full genome. I wasn’t sure what exons were or what ‘protein-coding’ meant. Even when I looked these phrases up on Google I was confused, as they seemed to be the same thing.
Results Section: Known Phenotype Summary
The section beneath this (Variation Counts) was similarly confusing, and contained more phrases that I didn’t understand than ones I did. I decided to move straight on to the ‘Known Phenotype Summary’ (shown below).
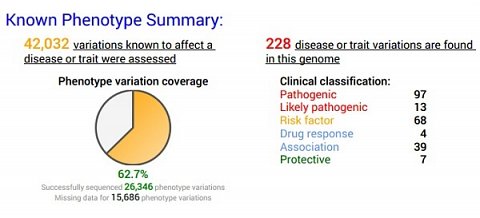
My Known Phenotype Summary.
This section was much easier to make sense of, despite also containing a few words I wasn’t sure about. I already knew that pathogenic meant something able to cause disease, but even if I hadn’t, I would have been able to at least get an idea of its meaning from the colour coding. It was slightly alarming to see that I had 228 disease or trait variations, but when I went down the list, I was relieved to see that some were to do with drug response or even protective. I was uncertain of exactly what ‘Association’ meant, but guessed that it indicated some sort of unconfirmed association with a disease. I hoped it would be explained further in the full results.
Results Section: Selected Phenotype Variation Details
The next section of the report went into some of the variations highlighted in the Known Phenotype Summary in more detail. My top result was for Lynch syndrome, shown below.
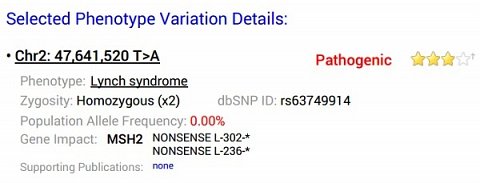
My Lynch syndrome result.
This condition was something that had been identified as a risk in other analyses I’d had done previously, which immediately increased my trust in the results. The top of the result was a bit intimidating, with lots of numbers, letters and symbols in a seemingly random order. I assumed that ‘Chr2’ indicated which chromosome the gene was located on, but couldn’t work out the rest.
That said, I imagine it would have been useful information for those people, such as geneticists or science students, that know how to interpret it. Additionally, there were many other features of were easier to understand.
One I particularly liked was the star rating system, used for all of the results. At first, I wasn’t sure what it was being used for, but noticed the little † symbol which was linked to a key (shown below).
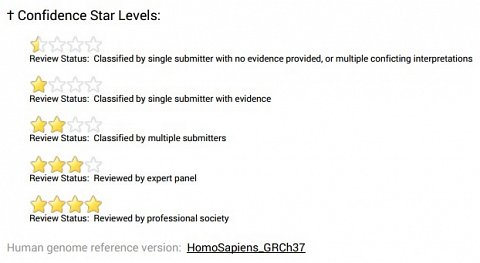
Explanation of the star rating system.
This star rating gave a clear indication of how reliable this assessment was, as I could see that the evidence for my Lynch syndrome result, for example, had been reviewed by an expert panel (three out of a possible four stars) .
The description of Lynch syndrome was also surprisingly detailed but understandable. It included facts and figures that were easy to interpret and used straightforward language throughout. I was slightly surprised that it was written in such a small font and seemed to be more of an extra than an integral part of the result. However, considering that the Enlis software is primarily focussed on allowing its users to carry out detailed data analysis, rather than providing explanations or descriptions associated with the conditions, this was understandable.
Publications used to support the conclusion were included in addition to the star rating, further adding to my trust in the results. I also appreciated that they had been hyperlinked to a page where I could read through them myself.
The next part of the report looked at my cystic fibrosis risk. This confused me at first, as I thought it was a condition that, if affected, you had from birth. However, I realised that this probably meant I was a carrier of the condition, meaning I could possibly pass it on to my children. Results from another test I’ve taken have also highlighted this variant, but concluded that it wasn’t a cystic fibrosis causing mutation. Although I couldn’t tell which was correct, I understood why it had been identified as a possible risk, and again was pleased to see a level of consistency in the genetic variants that had been used to assess my risk.
To get a better idea of whether or not this variant was likely to increase my risk of passing on cystic fibrosis to my children, I decided to look at the supporting publications, and was slightly disappointed. The first, rather than being a study, was a set of laboratory guidelines for undertaking population studies when investigating cystic fibrosis, and the second seemed just to conclude that genetic testing for cystic fibrosis was more complicated than previously thought.
The final result in my Genome Summary report was about maple syrup urine disease. I had one variant associated with this condition and it explained that those with the ‘classic’ form would experience a variety of life-threatening symptoms a few days after being born, but those affected by the intermediate type would have much milder symptoms. I’ve never experienced any of symptoms that were described, so I hope I’m unaffected. I wasn’t sure if having this variant meant that I was a carrier, and this wasn’t mentioned as part of the result.
Results Section: Interesting Variations of Uncertain Significance
My Selected Phenotype Variation Details were followed by a list of the 224 other conditions I could read about if I were to buy and download the Enlis software. There were also some other variations which had been picked out as interesting but whose clinical significance was uncertain. I liked that this section was included, as it gave me an idea of other possible conditions that might be associated with my set of variants. The fact that the significance of these was uncertain reminded me that research is constantly ongoing and changing.
Phenotype Report
The second half of the results were in the Phenotype Report, which focussed exclusively on one condition, macular degeneration. I wasn’t entirely sure why this disease had been chosen, especially as this hadn’t been flagged up in my Summary Report.
This report started with a ‘Variation Summary’ table, shown below.
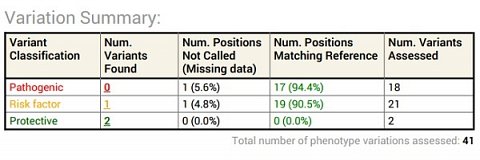
My Variation Summary.
As with much of the information in the Summary Report, some of the details were easy to interpret, but other parts were more difficult to understand. For example, the table seemed to indicate that I had two variants that might have a protective effect in terms of macular degeneration, and none with a likely pathogenic effect. However, I also had one that was classed as a ‘Risk factor’ which I wasn’t really sure about. I guessed that it was associated with the condition, but less so than those classed as pathogenic.
The report moved on by going through each of the three variants included in the Variation Summary table in more detail. It used the same star rating system as in the Summary Report, but unfortunately each was only rated half a star, so I couldn’t be sure that the information was something I could take any real meaning from.
One aspect that I particularly liked, however, was the ‘Limitations’ section, which set out some of the reasons that the results weren’t necessarily a full picture of my risk of suffering from macular degeneration. It identified two variations of the gene that hadn’t been screened for in the sequencing I’d had and noted that the sequencing data hadn’t been verified by Enlis, so they couldn’t verify how accurately the variants in my file reflected those actually present in my DNA. It was also explained that research into the various factors that affect the disease is still ongoing, and the current view is by no means complete. This helped me to further understand why they had warned that the results shouldn’t be taken as medical advice.
Summary
The Enlis Genomics report was interesting but complex. One aspect that I particularly enjoyed was the use of stars, which indicated the level of research supporting each result. For a service that appeared to be much more academically than consumer focused, I was surprised that the references were a bit vague. I also wasn’t sure why macular degeneration had been focussed on in my phenotype report, as I didn’t appear to be at particularly high risk of this disease.
This report would best suit someone interested in deeply exploring the scientific details and research associated with their genetic variants, but probably not someone who is looking for a straightforward and easily implementable guide to their DNA data.


