

At a Glance
Summary
I was pleased by how thorough the ‘Food and Pet Sensitivity’ report was. I felt that each result was gone into in detail, and was grateful that each gene and location they had looked at was provided, along with the research HomeDNA had used, so that – if I wanted – I would be able to look up the literature myself.
The results revealed that I was likely to be sensitive to gluten – which I suspected – and that I may have other sensitivities (dairy, dog dander, etc.) that I previously hadn’t thought of.
I thought the test was worth taking if you suspect you have some sensitivities, but are not yet certain enough about what they are to see a doctor. However, if the sensitivity you suspect you have falls in the “Other Foods” category of the report (shrimp, soy, yeast, etc.), then the results may not be detailed enough for you.
Full Review
HomeDNA is a brand belonging to DNA Diagnostics Center (DDC), an international company established in 1995, that processes more than a million samples each year in their Ohio-based laboratory. DDC and HomeDNA specialise in all sorts of DNA testing, from paternity tests to ancestry or pet DNA tests.
Product Expectations
I went to the HomeDNA website to learn more about the DNA test I planned to take: ‘Food and Pet Sensitivity’. I read that the test would reveal how my genetics could make me more sensitive to common irritants, which I gathered would increase the likelihood of allergy. This wasn’t, however, an allergy screening test, but rather would show whether I was predisposed to being sensitive to substances that commonly provoke allergic reactions.
The common irritants covered by the test would include: gluten, lactose, cow milk protein, egg, peanut, other foods, histamine, and pet dander.
My results would include analysis of “sensitivity-specific” DNA markers, lifestyle and dietary suggestions, recommended supplements to help manage sensitivities, and tasty substitutions for any foods I may be sensitive to.
I saw that the kit would include cheek swabs for taking a DNA sample, instructions, and a postage-paid envelope (only for US customers) for returning a sample to the lab. Once the lab had my sample, I would get my results six to ten weeks after they started testing.
In their FAQs, I read that for each test category, HomeDNA would analyse more than 30 genetic markers that research has connected to various sensitivities (the exact number varied by category). There was a “Resources” area, where I could view the studies used to support the diet, lifestyle, and supplement tips that would be included in my report.
Ordering Experience
It was easy to order through the HomeDNA website. Before placing my order, it was necessary to agree to the Terms of Use and Privacy Policy.
To purchase, I could log in, sign up, or continue as a guest. Creating an account required a full name, email, and password. Checking out, I had to give my street address and telephone number, and shipping preferences (standard was free). I could pay using a credit or debit card.
It took a few days for my DNA kit to arrive. It came in a compact package that resembled the one on the site, and contained a couple of cheek swabs, sample envelope, a prepaid return envelope, and instructions for taking the test.
After taking my sample (which was quick and painless), I registered my kit online, and sealed the cheek swabs in the envelopes provided, and mailed them back to the lab.
The Results
I received my results in the form of a PDF, which was emailed to me. The report was longer than I’d expected, covering nearly 30 pages!
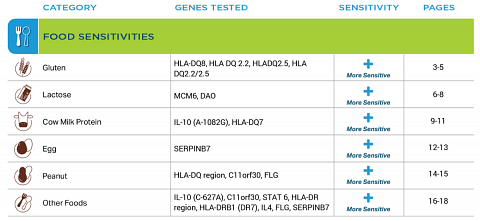
The results began with a results summary, with a table showing each potential sensitivity HomeDNA had tested for, the genes they had looked at, and whether I was more or less sensitive.

A snippet from my results overview, showing food sensitivity results.
To my surprise, my DNA results revealed that I was “more sensitive” to each of the sensitivities they had tested for! I decided to see how my results were discussed in detail…
Results Section: Food Sensitivities
Each result was gone into in a pleasing amount of detail. As stated, the DNA test was not diagnostic in nature, and so although my genotypes suggested I had a heightened sensitivity to certain allergens, I was not diagnosed with any allergies, and it was suggested I consult a medical practitioner to discuss any symptoms.
For gluten sensitivity, I saw they had looked at six points in my genome, and had concluded that – overall – my results suggested a greater likelihood of gluten sensitivity.

My genetic results for gluten sensitivity.
I was pleased to see that HomeDNA had looked at multiple genetic variants in order to get my results. It would, however, have been interesting to know which of these individual genotypes indicated increased or decreased sensitivity to gluten – or whether all my genetic markers showed increased sensitivity!
Still, since I had been given the positions of the genetic variants they had looked at, and my genotypes for each one, I could always do my own research if I wished.
The genetic results were followed by a “What You Can Do” section, which I thought was a useful supplement. The diet tips for gluten sensitivity were, admittedly, rather obvious – the first of the two being “Try a gluten-free diet”.
It was also suggested I try a nutrient-rich diet, along with certain vitamin and mineral supplements. In the information, I read that people with gluten sensitivity often have trouble absorbing nutrients. I hadn’t known this before, and so I thought this was a good tip.
I was surprised to see that I was predicted to be more sensitive to lactose, since I didn’t think I was lactose intolerant. Again, I saw that HomeDNA had looked at several genetic markers, and so I wondered how many of these suggested a greater likelihood of sensitivity.
Amongst the lifestyle tips they had provided, I saw that I could gradually increase my lactose tolerance over time by slowly increasing dairy intake, and it occurred to me that I may have been doing this inadvertently – hence why I’m not sensitive to dairy.

Lifestyle tips for handling lactose intolerance.
I also learned that I could use probiotics or take lactase enzyme to help me to digest milk.
Other food sensitivities analysed were cow milk protein, egg, peanut, and “other foods” (which included shrimp, apples, tree nuts, soy, soybean, fish, corn and yeast).
Results Section: Pet Sensitivities
The pet sensitivities section covered sensitivity to pet dander, specially cat and dog dander.
My genetic results showed a higher risk of sensitivity to dog dander, and a lower risk of sensitivity to cat dander. I’m not allergic to cats, but I didn’t think I was allergic to dogs either!
Amongst the lifestyle tips was the obvious – “Reduce exposure to pets” – but also some pretty good practical tips for keeping your home as dander-free as possible, such as using an air filtration system, grooming your pets, and reducing carpet and cloth, which pet dander can cling to.
I was interested to see that certain supplements could help reduce sensitivity to dander, particularly stinging nettle!

My supplement tips for reducing sensitivity to pet dander.
Results Section: Histamine Sensitivity
The next section covered histamine sensitivity, which I was also more genetically likely to have! In the “About” section, I read that histamine is found in some aged and fermented foods, such as red wine. I may be more sensitive to histamine due to my body’s inability to break it down.
Similar to hay fever, the symptoms listed included headaches, unexplained food sensitivities, swollen eyelids, red eye, and runny nose.

Some of the information about histamine sensitivity, including symptoms.
The tips for handling histamine sensitivity were pretty useful. I read that grilling or frying certain foods (particularly meats) can actually increase the amount of histamine, whereas boiling can sometimes reduce the amount, or keep the histamine level neutral.
I also read that certain medications can increase histamine sensitivity, and again there was a list of supplements that may be beneficial in reducing histamine and relieving symptoms.
The report ended with a glossary of gene definitions, and a list of the research articles HomeDNA had used to get their results.
Summary
I was pleased by how thorough the ‘Food and Pet Sensitivity’ report was. I felt that each result was gone into in detail, and was grateful that each gene and location they had looked at was provided, along with the research HomeDNA had used, so that – if I wanted – I would be able to look up the literature myself.
The results revealed that I was likely to be sensitive to gluten – which I suspected – and that I may have other sensitivities (dairy, dog dander, etc.) that I previously hadn’t thought of.
I thought the test was worth taking if you suspect you have some sensitivities, but are not yet certain enough about what they are to see a doctor. However, if the sensitivity you suspect you have falls in the “Other Foods” category of the report (shrimp, soy, yeast, etc.), then the results may not be detailed enough for you.
At a Glance
Summary
I thought that the Healthy Weight test from HomeDNA provided several in depth insights into my health, with useful weight loss recommendations. The report contained a lot of information, but it was organised and displayed in a clear way, meaning that I felt like I came away having learned something, without feeling overwhelmed by the information.
I particularly appreciated the personalised recommendations, especially the meal and exercise plans featured at the end of the report, which I look forward to using. I was a little suspicious of my Food result, which suggested I eat a lot more calories than I currently do and more than the standard recommended amount, but this was a pretty minor issue in what was otherwise a great report.
Full Review
HomeDNA is a brand that was recently established by DNA Diagnostics Center (DDC), one of the first consumer DNA testing companies to be set up. DDC was founded over 20 years ago, by Dr Richard Lee, and is now run by Connie Hallquist. The company carries out a wide range of DNA tests, including those that determine biological relationships (e.g. paternity, maternity etc.) and other types such as health and ancestry, from its lab in Fairfield, Ohio.
HomeDNA offers tests that focus on ancestry, skincare and health. After indulging in a little too much food and drink over the Christmas period, I was interested in trying out their diet and fitness ‘Healthy Weight’ test to see if personalised recommendations could help me stick to my New Year’s resolutions and January health-kick.
Product Expectations
I was able to find out a lot about the Healthy Weight test from the HomeDNA website. I read that it would identify my unique genetic makeup to provide me with personalised diet and fitness strategies, enabling me to take control of my own health. Information about the test was split into seven tabs, making it easy to find out exactly what I wanted to. I was happy to see that some of the science behind the test was explained and references were provided, giving me a better idea of how my DNA information would be translated into personalised health recommendations.
As well as information about the test, there were images of the kit and its contents. I could see that it would come with an instruction booklet, sample swabs, a DNA sample envelope and a return envelope, which included prepaid postage. I was pleased to have such a good preview of what to expect when I received my kit.
Ordering Experience
I clicked to add the test to my cart and proceeded straight to the checkout. I entered my address and phone number and was pleased to see that standard shipping, estimated to arrive in 7-12 days, was free. Moving on to payment, I was given the option to enter my card details directly or to use PayPal.
Reading through the terms and conditions, I was reassured that HomeDNA would only use my genetic data to provide me with the service I’d requested, in processing the order and to respond to any billing issues. They were quite straightforward, and I didn’t see anything that concerned me.
Once my payment had gone through, I received an email to confirm. My kit within the time estimated, though when it arrived, it was in an envelope rather than the box I’d seen on the website. This was okay in my case, but would have been a bit disappointing had the test been purchased as a gift. The swab samples were easy to take, though I was surprised that there was no instruction to leave them to dry, as they were then placed in a paper envelope. This envelope was placed in another card envelope, which didn’t allow any moisture to seep through, but I was still a little worried about whether this would affect the samples.
I registered my samples and set up an account, which the results would later be uploaded to, before sending them back to the lab via the prepaid envelope. When registering, I was asked to provide details of my gender, height, date of birth, weight and ethnicity, though was assured that this information wouldn’t be included in my report.
The Results
I received an email to confirm that my samples had reached the lab five days after I’d dispatched them, and another only ten days later, confirming that my results were ready. I was really impressed with how quick this was, as the website had advised that they would take around 6 weeks.
I was able to open the PDF report from the account I’d set up when registering. The front page was bright and personalised with my name, my test reference number, date of birth and report date. I scrolled down to an introductory section which explained that the report covered four main areas: ‘Weight Loss Ability’, ‘Food’, ‘Nutrients’ and ‘Response to Exercise’. Each result would be given a score, calculated using the results from all the relevant genes tested, and would be accompanied by a detailed explanation and success strategy.
Helpfully, there was also a section entitled ‘What is a gene?’ which explained a bit about the science behind the results. This was overall a helpful start to the report, which I thought provided the ideal level of complexity.
Results Section: Report Summary
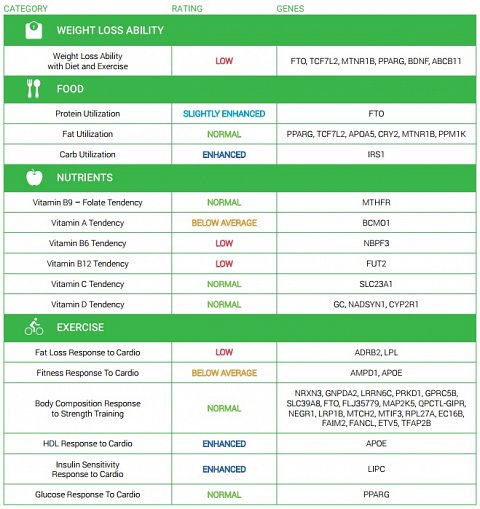
The first section of the report provided a summary of all of my results, displayed in a colour-coded table. It contained three columns headed ‘Category’, ‘Rating’ and ‘Genes’ and was also split into the four areas covered in the results (shown below).

My Report Summary.
The colours made it clear which results were good and which were less positive, and I was pleased to see that I didn’t have too many ‘LOW’ results. I was also impressed that the genes used to determine each result had been included.
Results Section: Weight Loss Ability
The first category of results was Weight Loss Ability. There was an introductory page before the actual result, that explained the impact genetics has on this area of health, how this had been investigated and that the result was given as a ‘LOW’, ‘BELOW AVERAGE’ or ‘NORMAL’ rating.
I scrolled down to see that my result was ‘LOW’, which was displayed on a meter (shown below).

My Weight Loss Ability result.
The accompanying explanation provided a bit more information about exactly what having a LOW weight loss ability result meant. I read that, due to ‘unfavourable gene combinations’ I was likely to find it harder to lose weight or maintain weight loss. However, it also explained that this didn’t necessarily mean I wouldn’t be able to lose weight, and that several environmental factors would also affect this. I was pleased that this explanation had been included, as I felt that this result could have been discouraging had I already been struggling to lose weight. Fortunately, I’m a healthy weight, but knowing I might find it extra difficult to lose weight I put on, is a good motivator to maintain a healthy diet and fitness routine.
The result of the section included diet and fitness tips, based both on my genetic results and the information I’d provided about my height, weight etc. during the registration process. I found these helpful and more specific than I’d expected. For example, I was advised to do between 200 and 300 minutes of exercise per week and recommended to do cardio rather than strength activities to optimise weight loss (though the benefits of weight training were also mentioned).
Finally, the Related Genes/SNPs section explained the scientific research that supported the result. I thought this was done at the perfect level of complexity and found the information genuinely interesting.
Results Section: Food
The next section of the report focussed on the best foods to eat for weight loss. This was set out a little differently, using a table and pie chart, rather than a meter, to show my results. The pie chart showed the relative amounts of ‘Lean Protein’, ‘Healthy Fats’ and ‘Complex Carbs’ I should be eating. As a pasta addict, I was pleased to see that my highest percentage (50-60%) was carbs! I was advised that my diet should be 20-25% protein and 25-30% fats.
I was surprised to see that, according to my genetic results and the information I’d provided, I was recommended to eat 3,139 calories per day to lose weight. This seemed high, and I realised how high when I checked the nationally recommended calorie intake for a woman of my age, which was 2000 1,400-2000 calories! I was worried that I had incorrectly entered my height or weight, but unfortunately there was nowhere to view or edit this information.
The table provided recommendations of exactly how many calories of each macronutrient I should be eating (shown below).

The Food table showing the recommended amounts of each macronutrient.
I appreciated that the amounts were shown as percentages, grams and calories, as it made it easy to compare to various food products.
I scrolled down to a summary of this information, and then three detailed sections on protein, fat and carb utilisation. These pages followed a similar format to the previous section, with meters showing my result for each. An explanation of what my these meant in practical terms was included beneath the meters along with diet and exercise tips and related genes.
I found out that I had a slightly enhanced ability to utilise protein, a normal ability to use fats, and an enhanced ability to use carbs. Whilst the introductory section had already given me an idea of what the results would be, these pages provided more detail and linked it to the sorts of foods I should be eating. There was a lot of interesting and useful information included, such as an explanation of the glycaemic index (GI), which is used to work out which carbohydrates are more and less healthy. I’d heard of this before, but had never really known what it was. I was therefore interested find out about it and appreciated being given enough of an explanation to actually use it as a tool to plan my diet.
Results Section: Nutrition
The next section provided further information about nutrition, specifically looking at the vitamins and minerals within my diet. This again started with a summary, using a table to show the nutrients, my ‘Tendency’ and foods in which these nutrients were found. This showed that I had a tendency for normal levels of folate, vitamin C and D, below average levels of vitamin A, and low levels of vitamins B6 and B12.
I was surprised to find out that nutrients such as these could affect my weight, as I’d always thought they were more to do with things like bone and skin health. It was also interesting to learn that just eating lots of foods containing the nutrients didn’t necessarily mean I would have high levels of them, as factors, such as how well my body absorbed and utilised them, also had an impact.
As someone that is a bit sceptical of supplements, I was pleased to see that getting the nutrients primarily through food was recommended. It also warned, if taking supplements, to be careful of the dose, as too much can actually cause toxic effects or interact with medications. There was also a more detailed section dedicated to each result in the section, like in the previous section. In addition to the meters, explanations and tips, each also came with a list of recommended foods. An example is shown below.

List of recommended foods in which to get vitamin A.
I found this useful and the explanations helped me to understand why it was important to get these vitamins, though they didn’t often refer to weight loss specifically.
Results Section: Exercise
Once I’d looked through my Nutrients results, I moved on to the Exercise section. There was again a summary, but it was longer and slightly different to the others. First, a short paragraph explained why different types of exercise are important for weight loss. This was followed by a diagram showing the recommended frequency, intensity and duration of cardio exercise I should be doing per week (shown below).

Diagram showing my exercise recommendations.
I thought this was a great way to provide an overall summary of the recommendations in this section, and found it clear and easy to work out exactly what I should do. It was also something I printed out and pinned up to remind myself of my goals.
In addition to this Cardio Exercise summary, there were strength training recommendations and activity suggestions.
Moving on to the more detailed results, I was disappointed to see that my ‘Fitness Response: Cardio’ result was below average and my ‘Fat Loss Response: Cardio’ was low, meaning that I’d have to work that bit harder to get fitter and lose weight through cardio activities. This does explain my natural aversion to exercise though!
More positively, I found out that my body’s response to resistance training was normal and my ‘HDL Response: Cardio’ was enhanced. I wasn’t sure what the second of these actually meant, so was pleased to find that there was plenty of information about it. It explained that HDL is known as ‘good cholesterol’ because it’s a molecule that takes cholesterol from the blood vessels (where it can contribute to dangerous plaque build-up) to the liver to be processed. I found this both fascinating and helpful to learn about.
Results Section: Custom Meal and Exercise Plans
The final part of the report was probably the most useful. I was provided with detailed week-long plans for both my meals and exercise routine. The meal plan provided simple, nutritious meals which, although not accompanied by recipes, seemed pretty easy to make. The ingredients were listed, along with information about the grams of each macronutrient, the calories, the quantity and measurement used to work out this quantity. I was a little disappointed that they were US measures, as I had been under the impression that this was a UK test, but this wasn’t a huge issue in what was otherwise I found this to be an invaluable guide to implementing the diet recommendations of the report.
The exercise plan was even more helpful. The recommendations were split into cardio and strength exercises, and provided options for various situations. For example, one table showed a suggested schedule for just using gym machines, while another showed a mix of home and gym based exercises.
The end of the report included definitions of some of the exercises mentioned, and then a list of references to the scientific studies supporting the results, conveniently sorted into the different categories of results.
Summary
I thought that the Healthy Weight test from HomeDNA provided several in depth insights into my health, with useful recommendations that will help me to lose weight. There was a lot of information, but it was organised and displayed in a clear way, meaning that I felt like I came away with a lot more knowledge than before, without feeling overwhelmed by the information. I particularly appreciated the personalised recommendations, especially the meal and exercises featured at the end of the report, which I look forward to using. I was a little suspicious of my Food result, which suggested I eat a lot more calories than I currently do and that is recommended, but this was a pretty minor issue in what was otherwise a great report.Please note that we were invited to take this test free of charge